








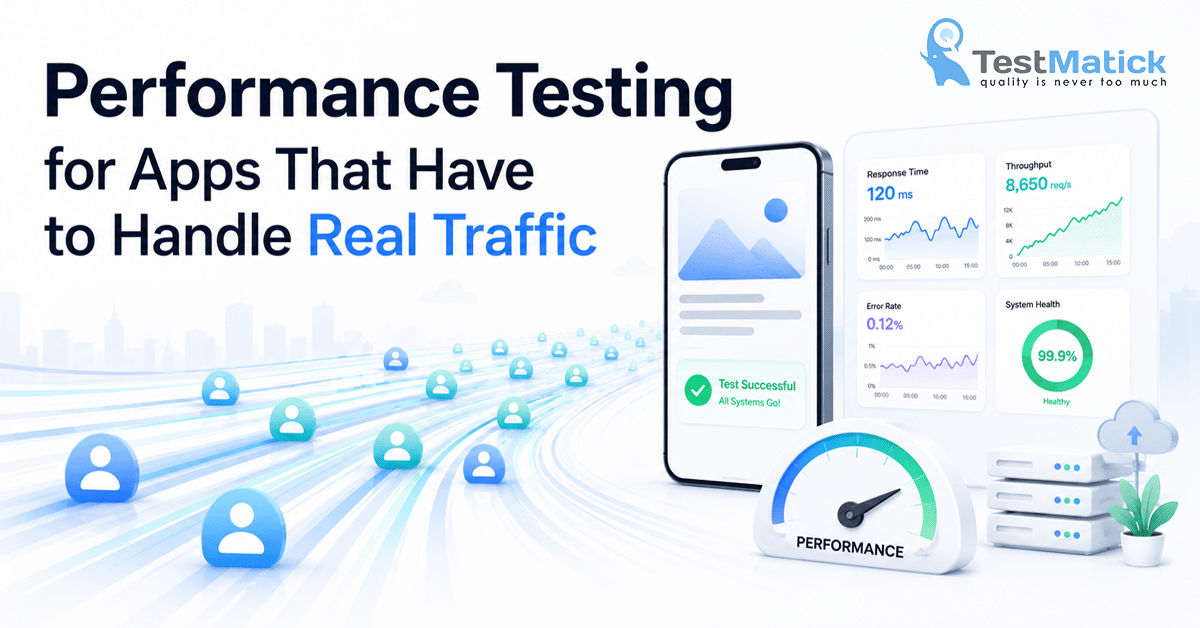
A practical guide to performance testing — from defining requirements to diagnosing bottlenecks
There is a specific type of engineering meeting nobody wants to be in. It happens when traffic spikes unexpectedly, response times climb past acceptable thresholds, and the team is debugging a system under live production load with real users waiting. The fixes that would have taken an afternoon during development now need to happen in minutes, under pressure, with incomplete information.
Performance testing exists to make that meeting unnecessary. Not by preventing traffic spikes — those are often good news — but by ensuring the system has been tested against realistic load before users arrive, and the breaking points are known quantities rather than surprises.
This guide covers everything you need to build a performance testing practice: the types of testing, tool selection, defining requirements, interpreting results, and the bottlenecks that cause most production performance failures.
Types of performance testing
Performance testing is not a single activity — it’s a category that includes several distinct test types, each designed to answer a different question about your application’s behavior under load.
Load testing
Load testing answers the question: how does the application perform under expected load? You simulate the number of concurrent users or requests you expect in normal operation and measure response times, throughput, and error rates.
Load testing is the baseline — the first performance test most teams run. It verifies that the application meets its performance requirements under conditions that should be survivable. If your application fails a load test at expected traffic levels, you have a critical problem. If it passes, you have a baseline to compare against.
Key metrics to capture: response time (average, median, 95th percentile, 99th percentile), throughput (requests per second), error rate, and resource utilization (CPU, memory, database connections).
Stress testing
Stress testing answers: where does the application break, and how does it fail? You gradually increase load beyond expected levels until the system fails, observing where failure occurs and how the system behaves at and beyond its limits.
The goal of stress testing is not to see the system pass — it’s to see it fail in a controlled environment. A graceful failure (queued requests, clear error messages, automatic recovery) is far better than a catastrophic failure (data corruption, cascading errors, unrecoverable state). Stress testing reveals which failure mode your system produces.
Stress tests also identify the breaking point — the load level at which the system fails — which informs capacity planning and scaling decisions.
Spike testing
Spike testing answers: what happens when traffic increases suddenly and dramatically? Unlike gradual load increases in stress testing, spike tests simulate sudden, sharp traffic increases — the kind produced by a viral social media post, a product launch, or a scheduled event where many users arrive simultaneously.
Spike testing is particularly important for consumer applications where traffic patterns are unpredictable and for B2B applications with scheduled events (payroll processing, end-of-month reporting, batch jobs that trigger at midnight).
Soak testing
Soak testing (also called endurance testing) answers: does the application degrade over time under sustained load? You run the application at moderate load for an extended period — hours or days — and monitor for performance degradation.
Soak testing catches problems that short tests miss: memory leaks that accumulate slowly, connection pool exhaustion that happens over hours, disk space issues from accumulating logs, and cache behavior over long time periods. These problems are invisible in a 30-minute load test and catastrophic in a production system that runs continuously.
A practical example: a SaaS analytics platform ran load tests that passed at 500 concurrent users with response times well within acceptable thresholds. In production, performance degraded every 3-4 days until the application became unresponsive and required a restart. A 48-hour soak test revealed the cause: a background job that processed incoming data events was creating a new database connection for each event and not closing it properly. Under the load test’s 30-minute window, the leaked connections were invisible. Over 48 hours of sustained load, they accumulated until the connection pool was exhausted. The fix — adding proper connection cleanup to the job — took two hours. Diagnosing it without a soak test had taken three production incidents over six weeks.
Volume testing
Volume testing answers: how does the application perform with large amounts of data? It tests whether performance remains acceptable as data volumes grow — the difference between 10,000 records and 10,000,000 records in a database table, or between a user with 100 transactions and one with 100,000.
Volume testing is especially relevant for data-heavy applications and for features that aggregate or report on large datasets. The query that performs acceptably in development with realistic but small data volumes often becomes a serious performance problem in production with real data accumulation.
Tools comparison
The performance testing tool market has several strong options. Here’s an honest comparison:
| Tool | Type | Best for | Learning curve | Cost |
| k6 | Load testing | Developer-friendly, CI/CD integration | Low | Free (OSS) + cloud |
| Apache JMeter | Load testing | Complex scenarios, GUI-based | Medium | Free |
| Gatling | Load testing | High-performance, Scala/Java teams | Medium-High | Free (OSS) + enterprise |
| LoadRunner | Enterprise load testing | Enterprise environments, legacy systems | High | Expensive |
| Locust | Load testing | Python teams, simple scripting | Low | Free |
| Artillery | Load testing | Node.js apps, quick setup | Low | Free (OSS) + cloud |
When to use each
k6 is the default recommendation for most teams in 2026. It’s JavaScript-based, integrates naturally into CI/CD pipelines, has excellent documentation, and the free tier covers most testing needs. If your team already uses JavaScript, the learning curve is minimal.
Here’s a minimal k6 script that runs a load test with 100 virtual users for 2 minutes and enforces performance thresholds as quality gates:
import http from ‘k6/http’;
import { check, sleep } from ‘k6’;
export const options = {
vus: 100,
duration: ‘2m’,
thresholds: {
http_req_duration: [‘p(95)<500’, ‘p(99)<1000’],
http_req_failed: [‘rate<0.01’],
},
};
export default function () {
const res = http.get(‘https://your-app.com/api/products’);
check(res, { ‘status 200’: (r) => r.status === 200 });
sleep(1);
}
The thresholds block enforces quality gates: 95th percentile under 500ms, 99th percentile under 1 second, error rate under 1%. If any threshold is breached, k6 exits with a non-zero status code — which fails a CI pipeline stage automatically. No manual result interpretation needed.
JMeter remains relevant for teams that need a GUI-based test design tool, complex test scenarios with conditional logic, or integration with enterprise test management systems. It’s more powerful than k6 for complex scenarios but harder to integrate into code-first pipelines.
Gatling is the right choice for Java or Scala teams that want code-first performance testing with excellent reporting. Its simulation DSL produces readable, maintainable test code and its HTML reports are among the best in the category.
LoadRunner is the enterprise incumbent — expensive, feature-rich, and appropriate for large organizations with dedicated performance testing teams and complex enterprise environments. For most modern SaaS companies, k6 or Gatling delivers equivalent results at a fraction of the cost.
Defining performance requirements
Performance testing without defined requirements produces data without conclusions. Before running any tests, define what ‘acceptable performance’ means for your application.
Response time requirements
Define response time thresholds at multiple percentiles, not just averages. Averages hide the experience of your slowest users — a 200ms average with a 5-second 99th percentile means 1% of requests are taking 5 seconds, which is a real user experience problem even if the average looks acceptable.
Practical starting thresholds for a SaaS application:
- API endpoints: p95 under 500ms, p99 under 1 second
- Page loads: p95 under 2 seconds, p99 under 3 seconds
- Search and filter: p95 under 1 second
- Report generation and exports: p95 under 5 seconds (with progress indication for longer operations)
These are starting points, not universal standards. Your specific requirements depend on your users’ expectations, your competitors’ performance, and your application’s nature.
Throughput requirements
Define the concurrent users and requests per second your application must support. Base these on your actual or projected traffic:
- Current peak concurrent users (from analytics)
- Expected growth over the next 12 months
- Traffic spikes: what’s the maximum plausible spike multiplier? (2x normal? 10x for a product launch?)
Your load test should target current peak, your stress test should target expected peak 12 months out, and your spike test should target your maximum plausible spike scenario.
Error rate requirements
Define an acceptable error rate under load. For most applications: 0% errors at normal load, under 1% at peak load, under 5% at stress load. Higher error rates indicate the application is degrading unacceptably.
Define which errors count: HTTP 500s always count. HTTP 429s (rate limiting) may be acceptable depending on context. Timeouts always count. Treat your error rate threshold as a hard quality gate in automated performance testing.
Interpreting test results
Performance test results contain more information than pass/fail. Knowing how to read them is as important as running the tests.
Response time distribution
Always look at percentile distribution, not just averages. A response time graph that shows average, p50, p95, and p99 over time tells you much more than average alone. Watch for:
- Rising p99 while p50 stays flat: a subset of requests is getting significantly slower, often indicating a specific code path or query that degrades under certain conditions
- All percentiles rising together: systemic degradation — the entire system is slowing down, often indicating resource saturation (CPU, memory, database connections)
- Flat response times that suddenly spike: a threshold being crossed — connection pool exhaustion, cache eviction, garbage collection pause
Throughput and saturation
Plot throughput (requests per second) against virtual users. In a healthy system, throughput increases as virtual users increase until the system reaches saturation — the point where adding more users doesn’t increase throughput because the system is fully utilized. The saturation point is your system’s capacity.
A system that never saturates gracefully — where throughput collapses rather than plateaus — indicates a bottleneck that causes cascading failures rather than graceful degradation. This is the failure mode you most want to prevent.
Watch for the ‘knee of the curve’ — the point where response times begin increasing faster than load increases. This inflection point, typically at 60-70% of maximum throughput, is your practical operating ceiling. Running continuously at or above the knee causes progressively worse response times and eventually cascading failures. Capacity planning should target keeping peak load below the knee, not below the breaking point.
Resource utilization tells you where the ceiling is coming from. CPU saturation means you need more compute. Memory saturation means you need more RAM or you have a leak. Database connection pool exhaustion means you need more connections or more efficient query patterns. Network saturation is rare but indicates bandwidth limitations. Identify the constrained resource before scaling — scaling horizontally when the bottleneck is a shared database doesn’t help.
Error rate analysis
Correlate error rate with load level. Errors that appear only at high load indicate capacity problems. Errors that appear at any load level indicate bugs. Errors that increase gradually with load indicate resource contention. Errors that spike suddenly at a specific load level indicate a hard limit being hit — a connection pool maximum, a rate limit, a queue overflow.
Real case: E-commerce site during Black Friday
A mid-size e-commerce platform — fashion retail, 2.3 million registered users, peak daily traffic around 45,000 sessions — ran their first serious performance test six weeks before Black Friday after experiencing degraded performance during a smaller promotional event earlier in the year.
The load test revealed the application handled normal traffic (500 concurrent users) well — p95 response times under 400ms, error rate near zero. At 2,000 concurrent users — their projection for Black Friday peak — the picture changed dramatically. Checkout response times climbed to 8.4 seconds at p95. The product search endpoint, which ran a complex database query with multiple filters, timed out entirely above 1,500 concurrent users.
Database profiling identified two critical bottlenecks:
First, the product search query performed a full table scan on the products table (1.2 million records) because it was filtering on three columns — category, price range, and availability — without a composite index covering all three. Adding the composite index reduced search response time from 4.2 seconds to 180ms under the same load.
Second, the checkout flow made 11 separate database queries in sequence — one for the cart, one for each item to verify inventory, one for the user’s saved payment method, one for the shipping address, and several for pricing calculations. Under concurrent load, each query competed for database connections, causing the connection pool to exhaust. Combining the sequential queries into 3 batched queries and increasing the connection pool size from 20 to 50 connections resolved the checkout bottleneck.
With both fixes deployed, the platform was re-tested at 3,000 concurrent users — 50% above the Black Friday projection. Checkout p95 response time: 380ms. Search p95: 220ms. Error rate: 0.2%. The fixes required 11 days of development work — significantly less than the production incident response would have required during an actual Black Friday outage.
Black Friday actual peak: 2,700 concurrent users. The application handled it without incident.
Common performance bottlenecks and fixes
Most performance problems fall into a small number of categories. Here’s the reference guide:
| Bottleneck | Symptoms | Diagnosis | Common fix |
| N+1 queries | Response time grows linearly with data size | Database query profiling | Eager loading, query optimization |
| Missing database indexes | Slow queries on large tables | EXPLAIN ANALYZE, slow query log | Add composite indexes |
| No caching | Repeated expensive computations | APM profiling | Redis/Memcached for frequent queries |
| Synchronous blocking | Long response times, low CPU | Thread/async profiling | Async processing, queues |
| Memory leaks | Performance degrades over time | Memory profiling over time | Fix resource cleanup |
| Insufficient connection pooling | Timeouts under concurrent load | DB connection monitoring | Tune pool size |
The diagnosis-first principle
Every fix in the table above is straightforward once you know what you’re fixing. The hard part is diagnosis — identifying which bottleneck is causing the problem. Performance optimization without profiling is guesswork, and guesswork often fixes the wrong thing while the real bottleneck persists.
The diagnosis workflow: run a load test, observe where response times degrade, profile the slow requests (APM tools like Datadog, New Relic, or open-source options like Jaeger), identify the slow operations (database queries, external API calls, computation), fix the slowest operation, re-test. Repeat until performance meets requirements.
This iterative approach is more effective than attempting to optimize everything at once. In most applications, 80% of performance problems come from 20% of the code — usually a small number of critical database queries and high-traffic API endpoints. Fix those first.
Performance testing as part of your release process
Performance testing done once before a major launch is better than nothing. Performance testing integrated into your regular release process is dramatically better.
The practical integration: run a baseline load test against staging before every significant release. Compare results against your baseline — if response times have increased by more than 10-15% without a corresponding feature change that explains it, investigate before deploying. Automated performance regression detection in CI/CD pipelines is achievable with k6’s threshold system and catches performance regressions the same way functional test suites catch functional regressions.
A concrete implementation: store your baseline performance metrics — p95 response time per endpoint, throughput at standard load — in a configuration file alongside your codebase. Run a k6 script in CI that compares current results against the baseline and fails the build if any endpoint degrades beyond the threshold. This adds 5-10 minutes to your pipeline and catches the slow query introduced by last week’s feature before it reaches production.
Teams that integrate performance testing into their release process consistently report a different experience from teams that test performance periodically: instead of discovering performance problems under production load, they discover them during development — when the developer who introduced the slow query is still context-switched into that code and the fix is straightforward. The difference in cost is not marginal. It’s an order of magnitude.
Ready to test how your app performs under real load?
TestMatick has been running performance audits for SaaS and e-commerce products since 2009. If you have an upcoming launch, a scheduled traffic spike, or just want to know where your application’s limits are before your users find them — that’s a conversation worth having.
-> Schedule Performance Audit — testmatick.com



0 Comments